2023 · Professional
Firm AUM and Production Dashboard
A live Power BI view of firm assets and production — built so partners and advisors can share one current picture of how the firm is doing.
Context
Partners at The Fox Alliance Wealth Advisors needed a shared view of firm assets under management and production. The numbers existed, but they lived in pieces — and people were spending too much of each month reassembling them.
Problem
Reporting was done by hand. Advisors and partners lacked one place to see AUM, production mix, and how those metrics moved over time. Without that, it was harder to have grounded conversations about the firm’s trajectory.
Approach
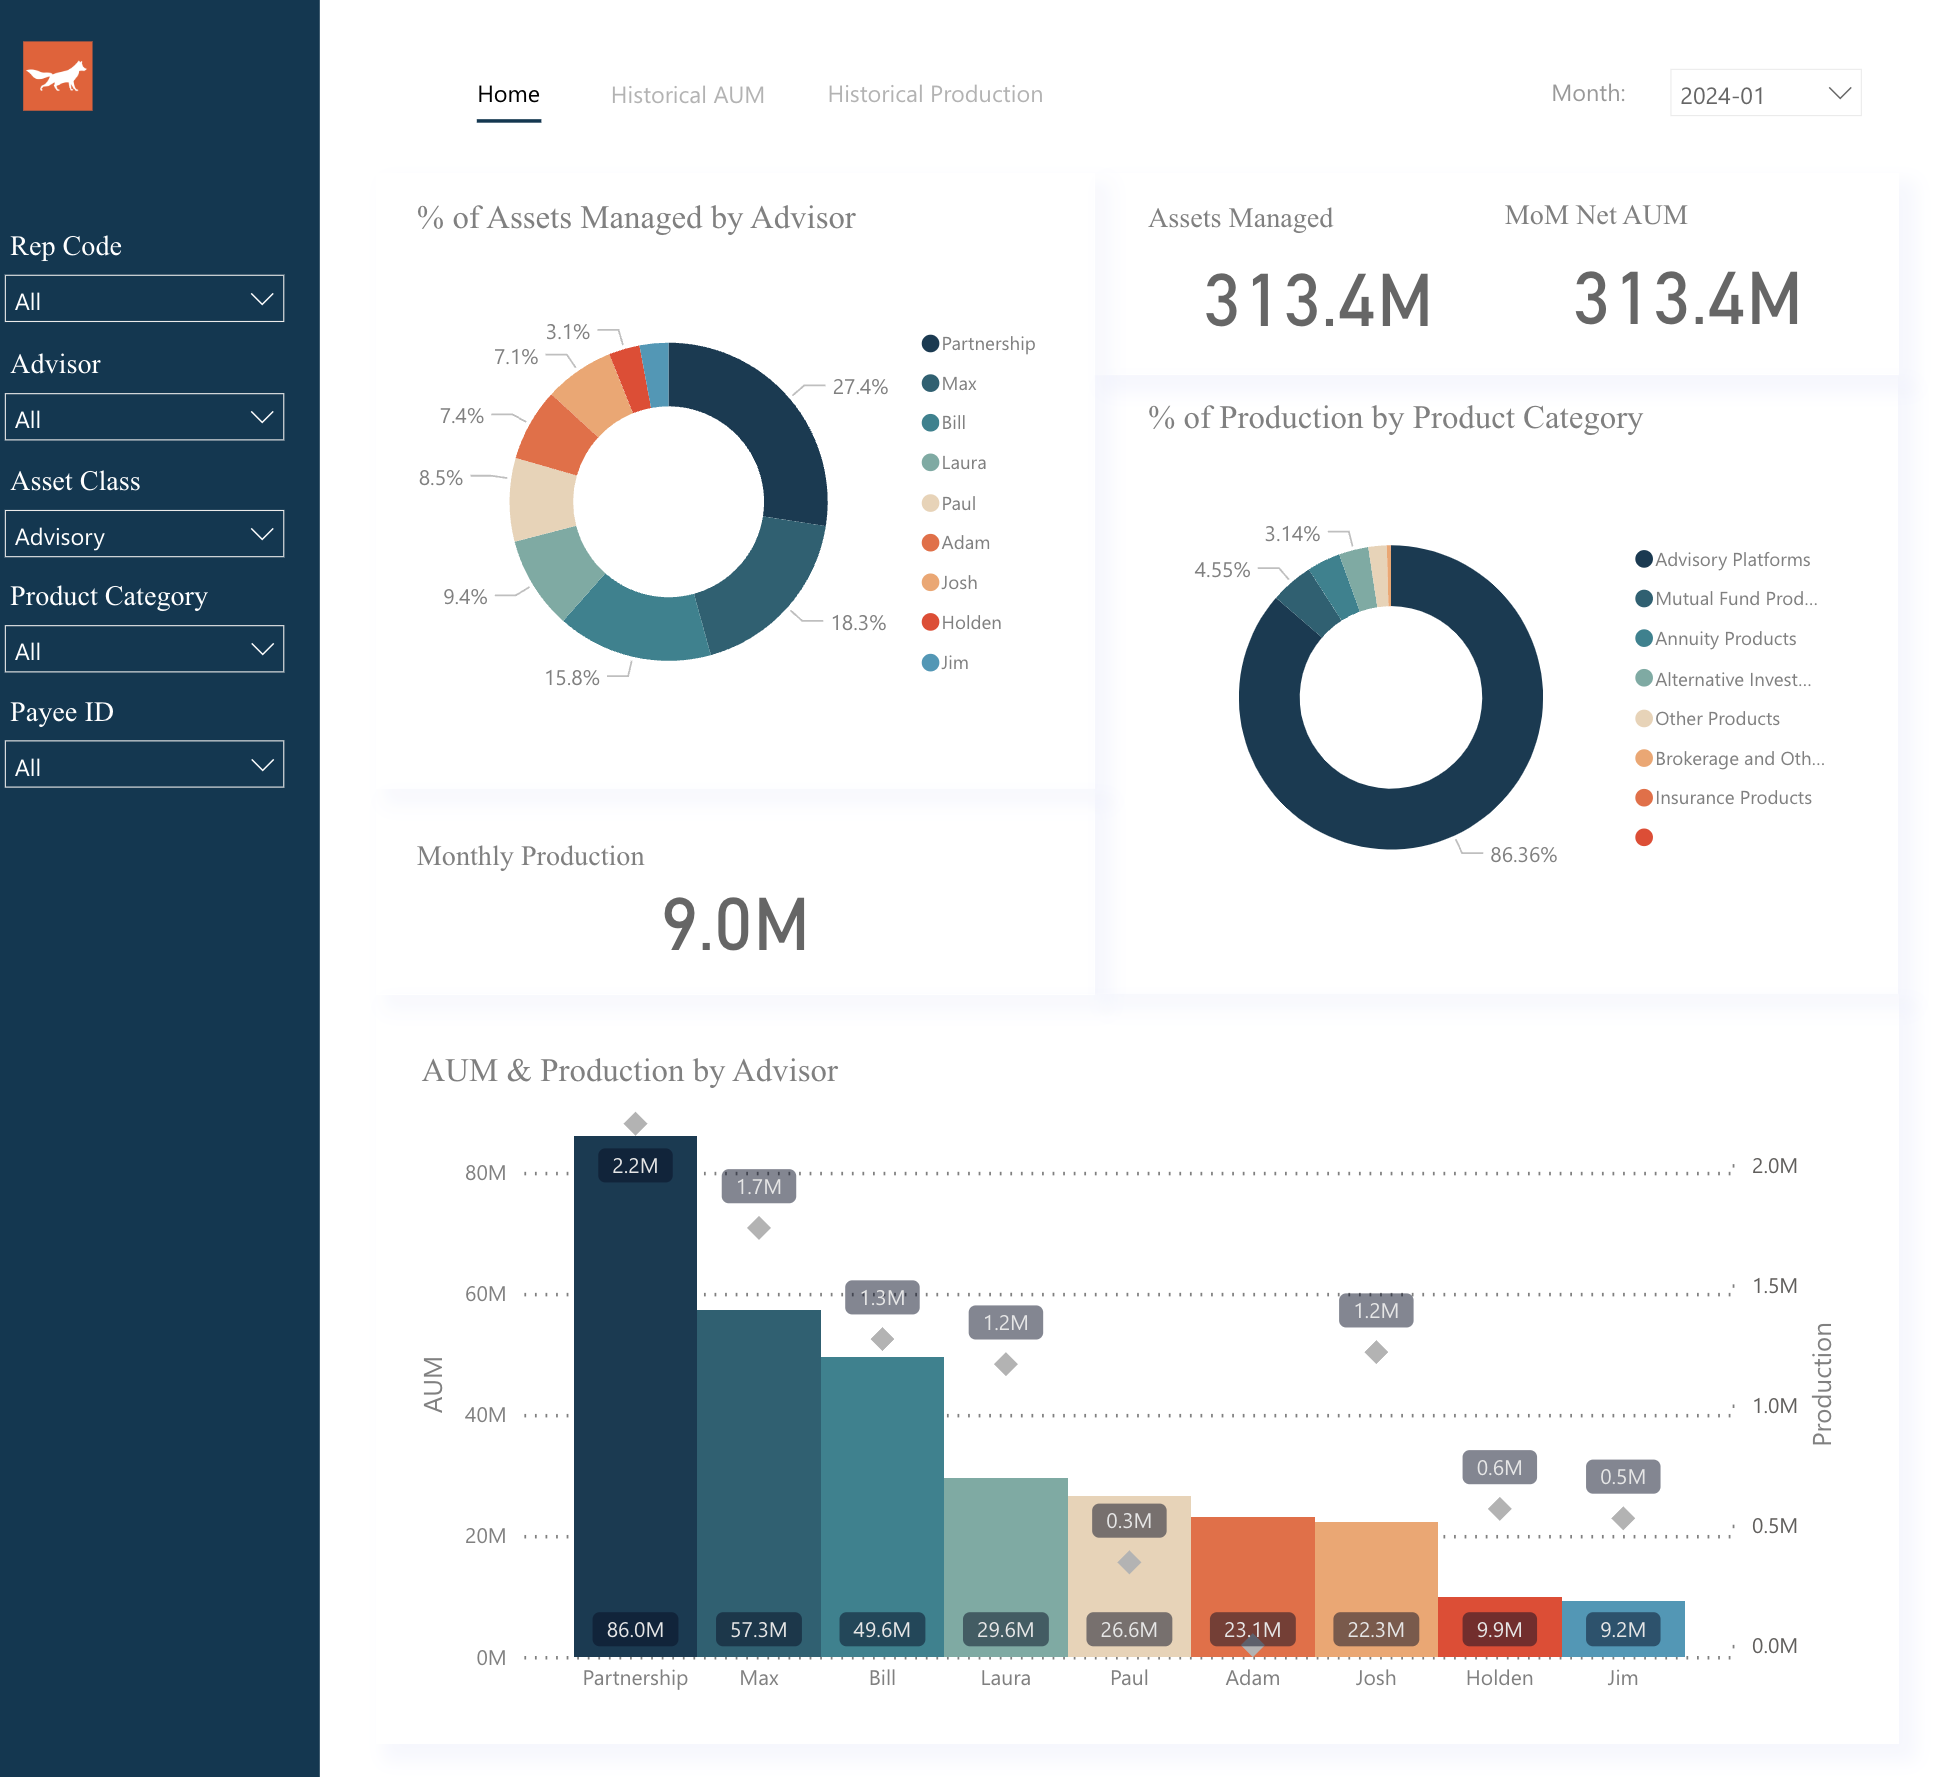
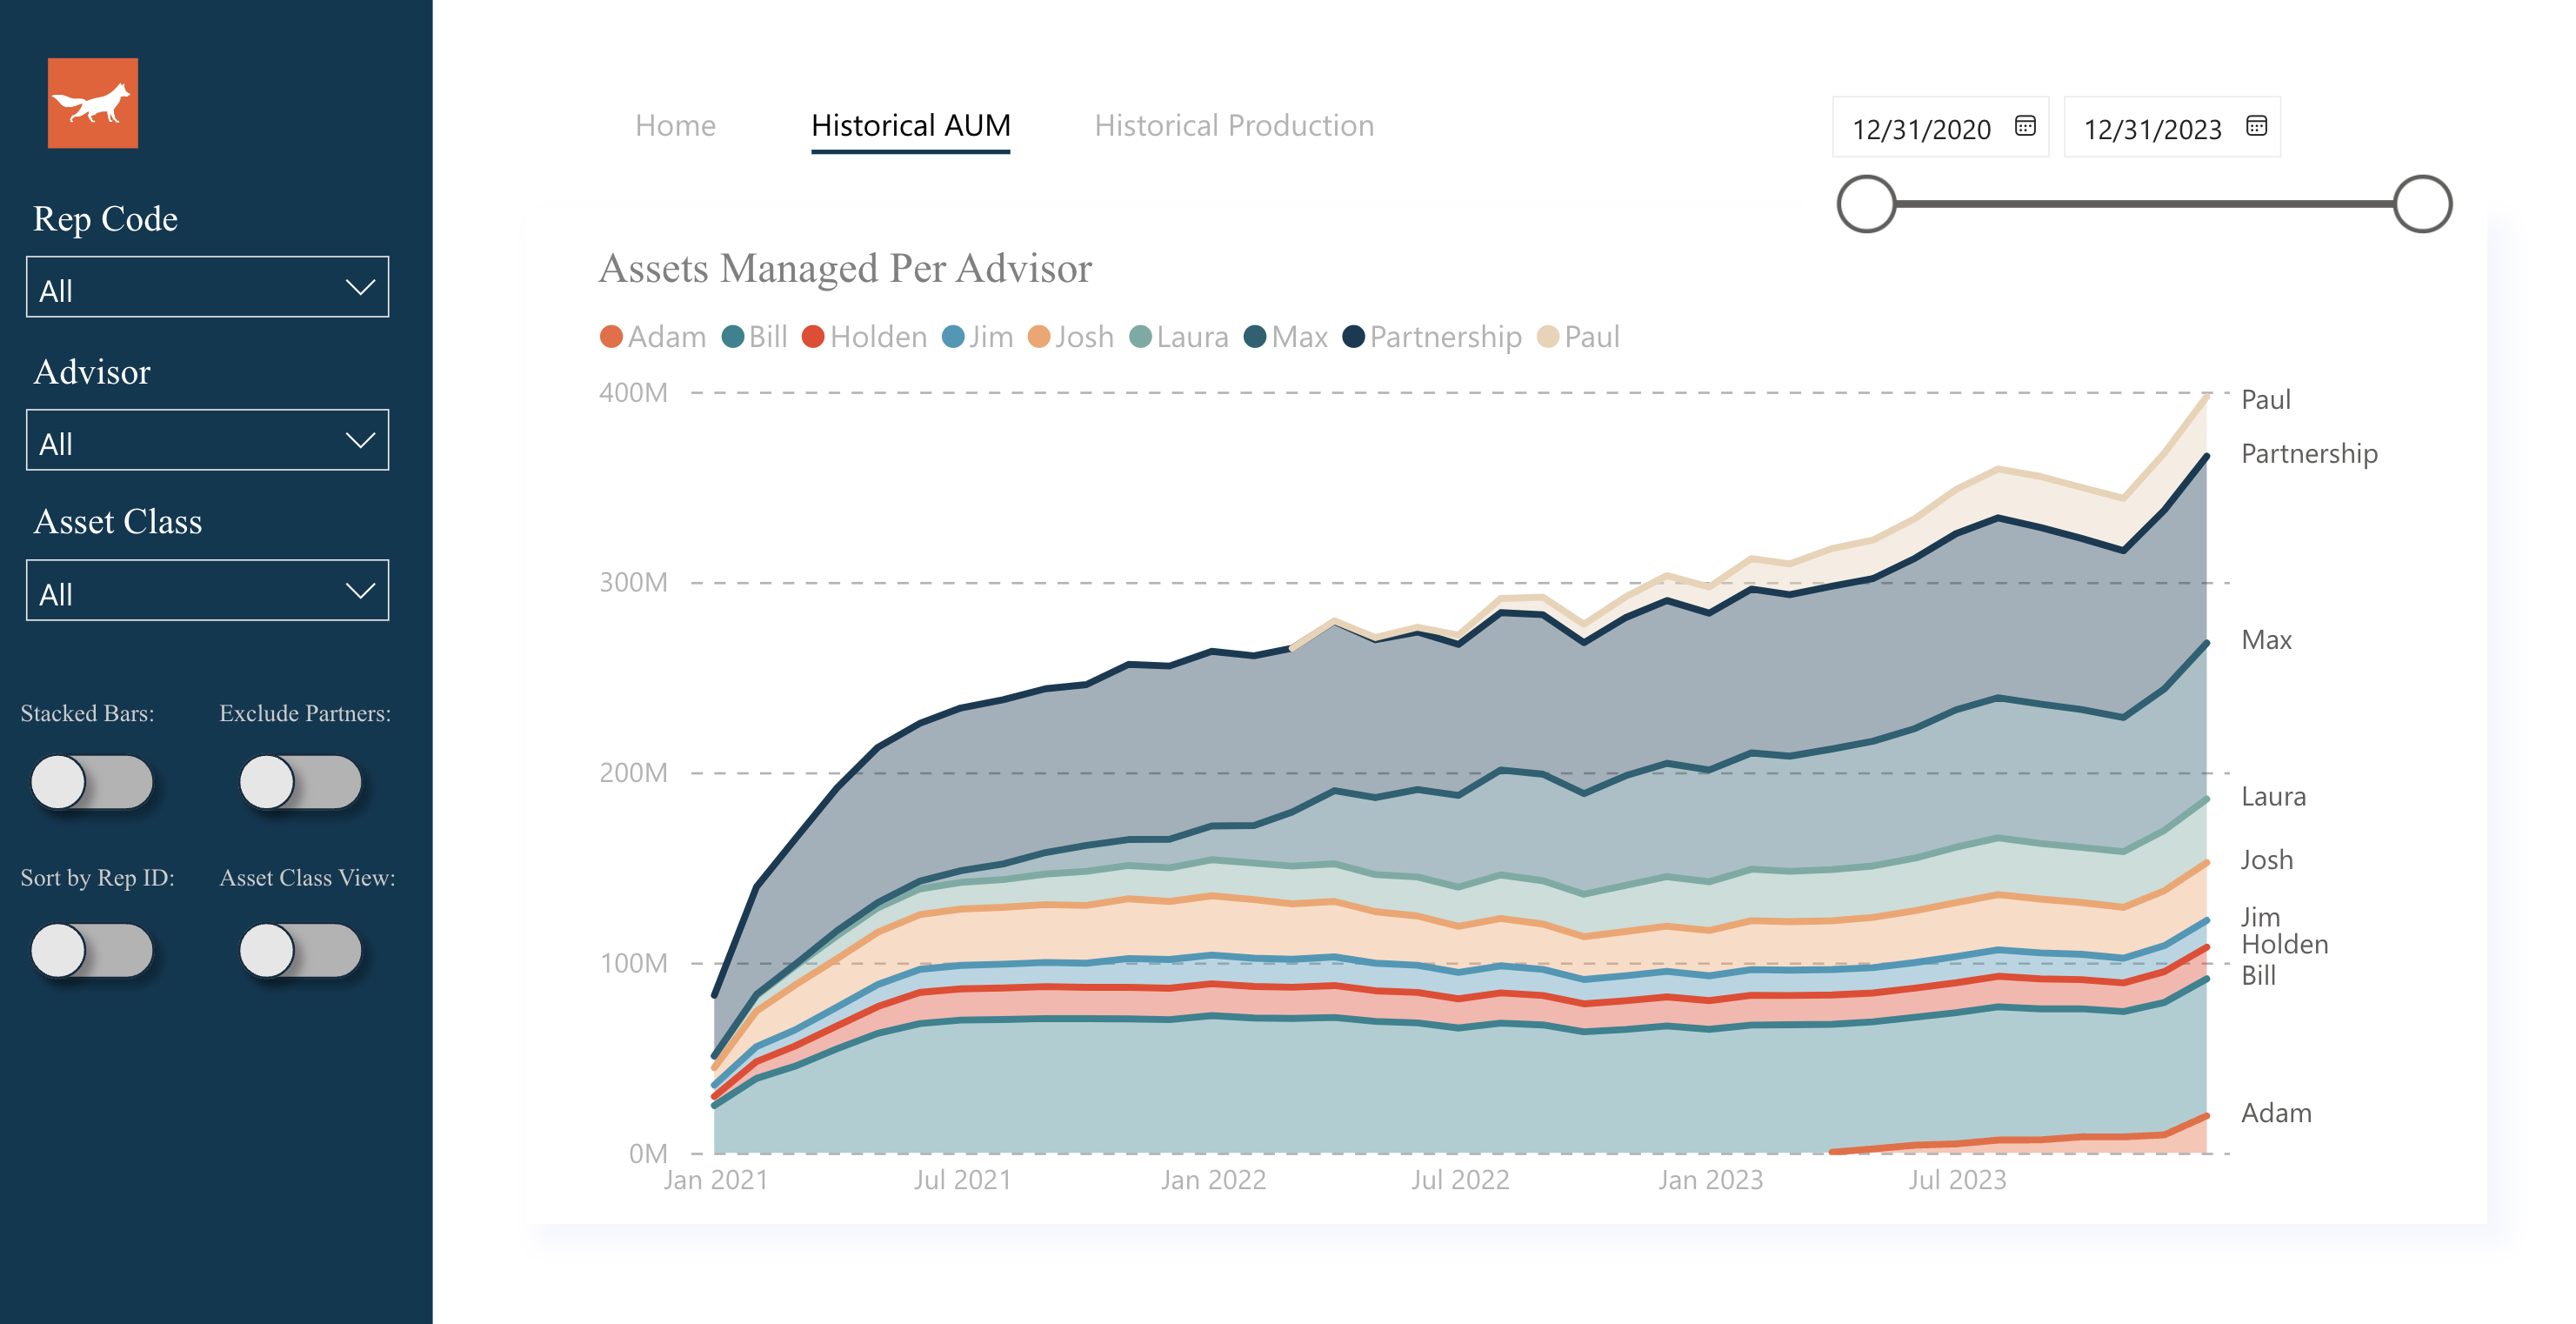
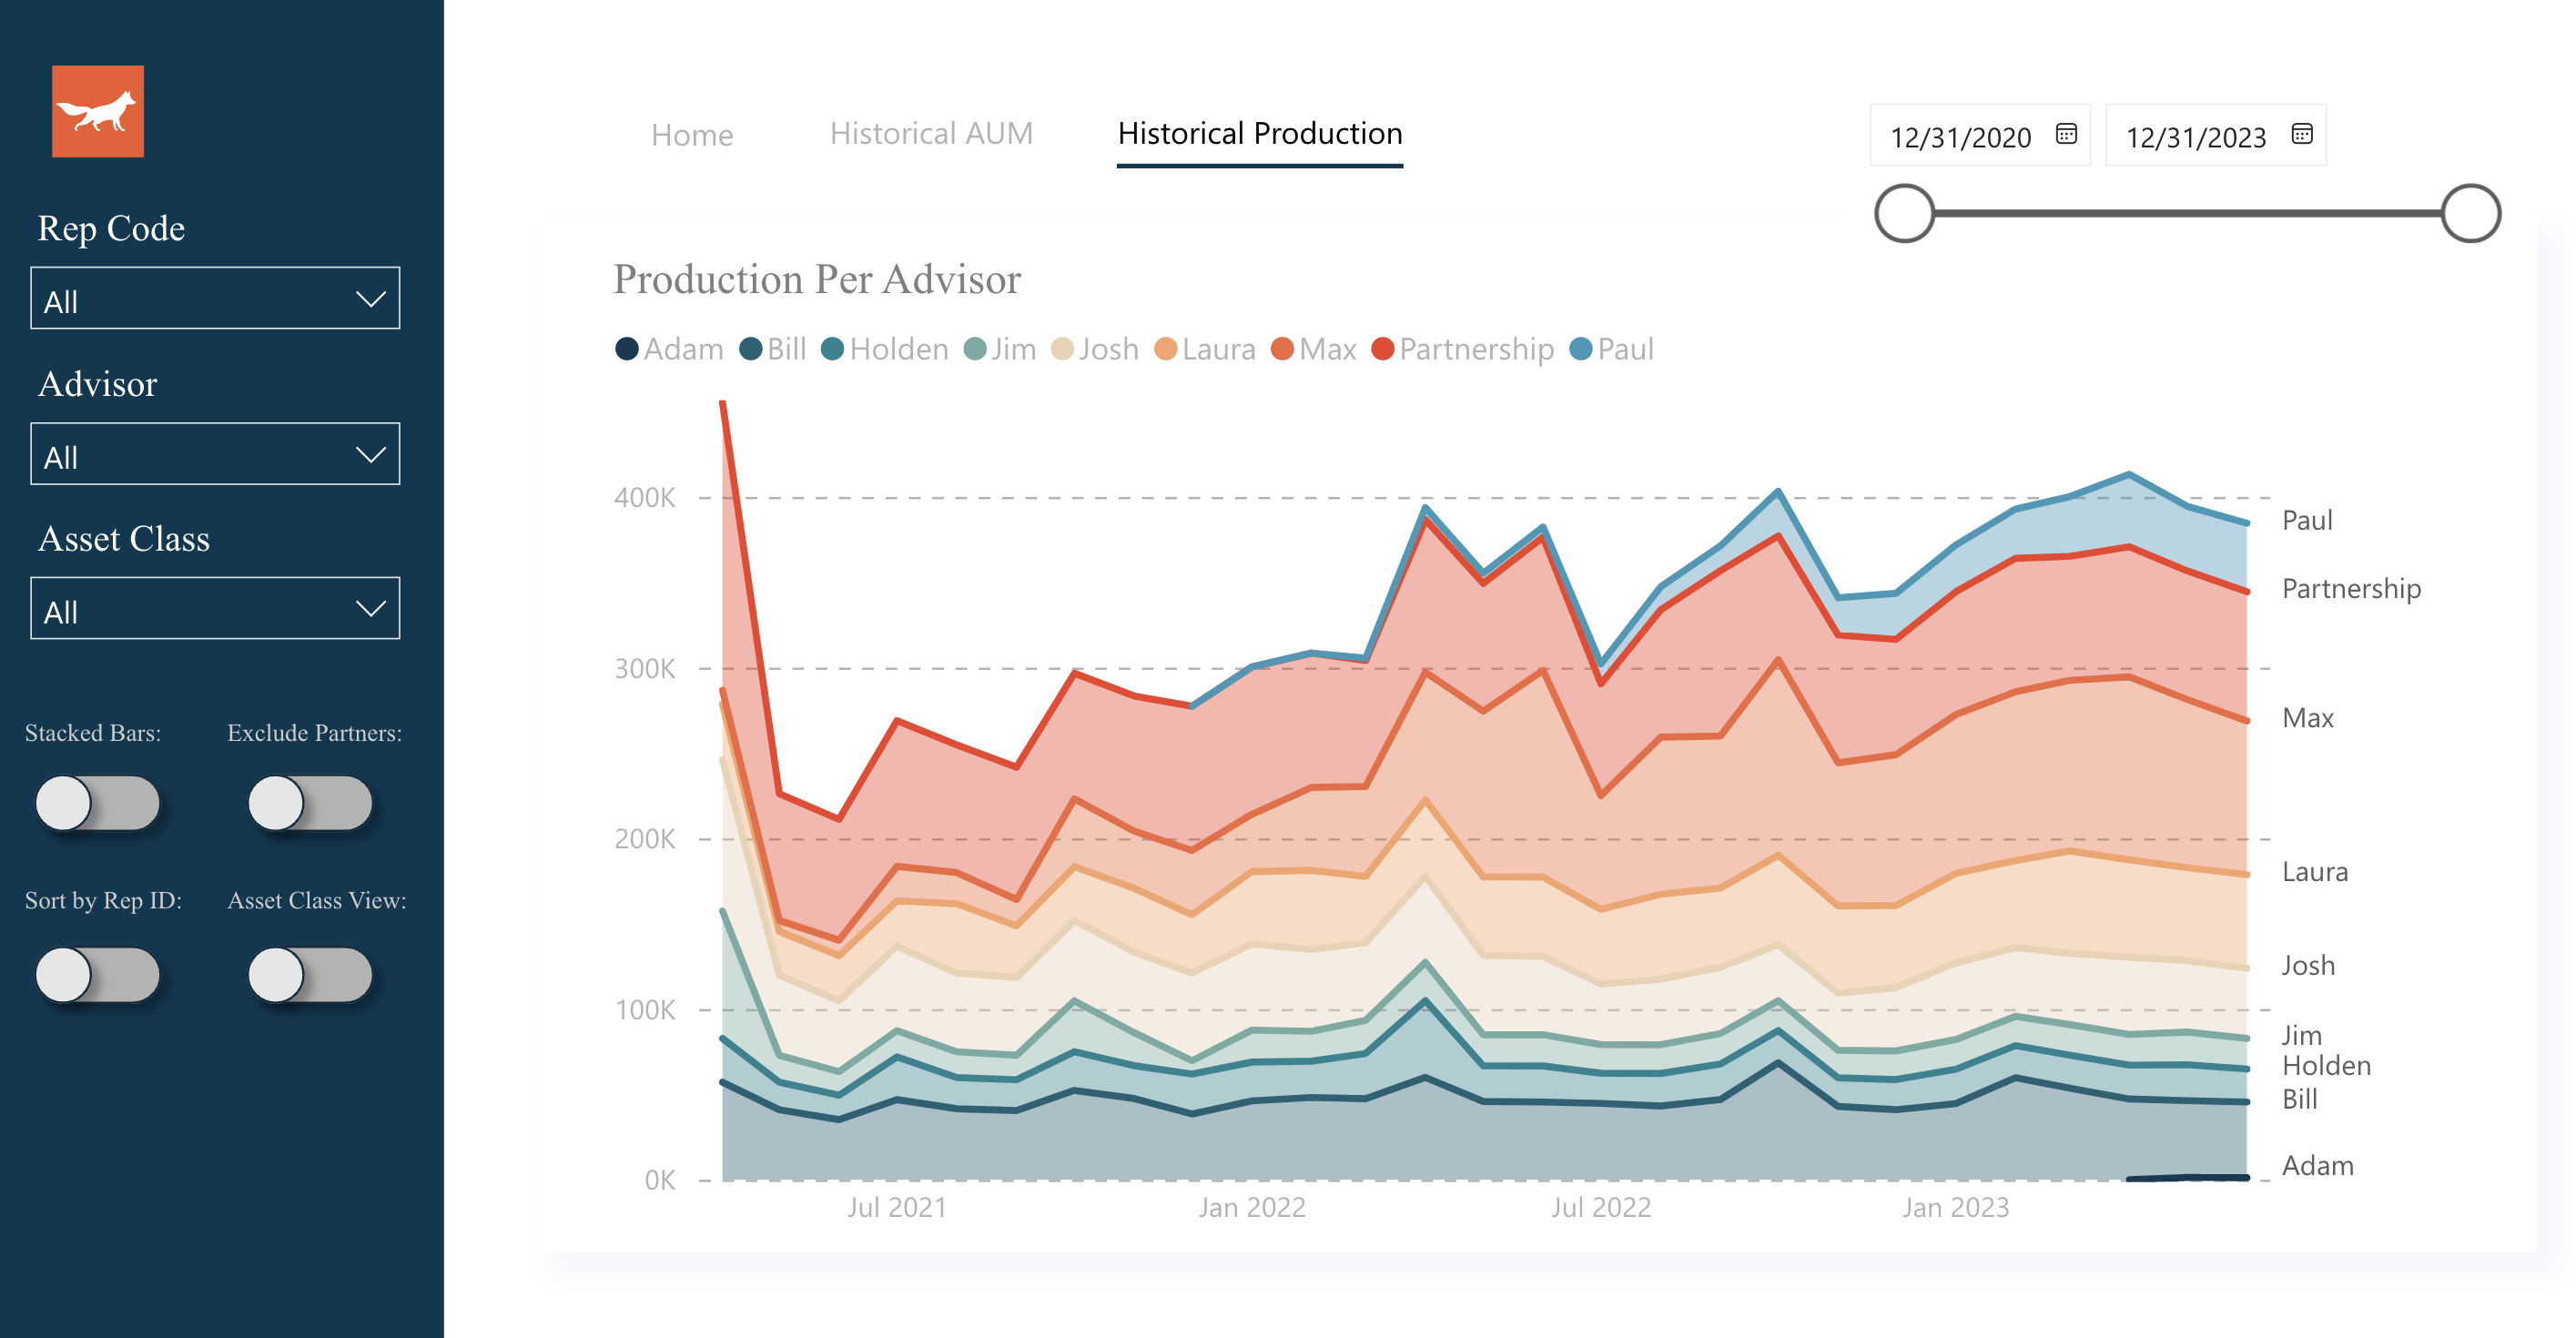
I compiled a database of more than 224,000 rows and taught myself Power BI along the way. The dashboard covers total firm AUM, share of AUM by advisor, month-over-month growth, production by product category, advisor-level relationships, and historical trends — with a live connection so the monthly refresh stays honest.
Result
Partners can see firm AUM and production in one place. Manual monthly assembly gave way to a live reporting connection that people can trust without chasing spreadsheets.